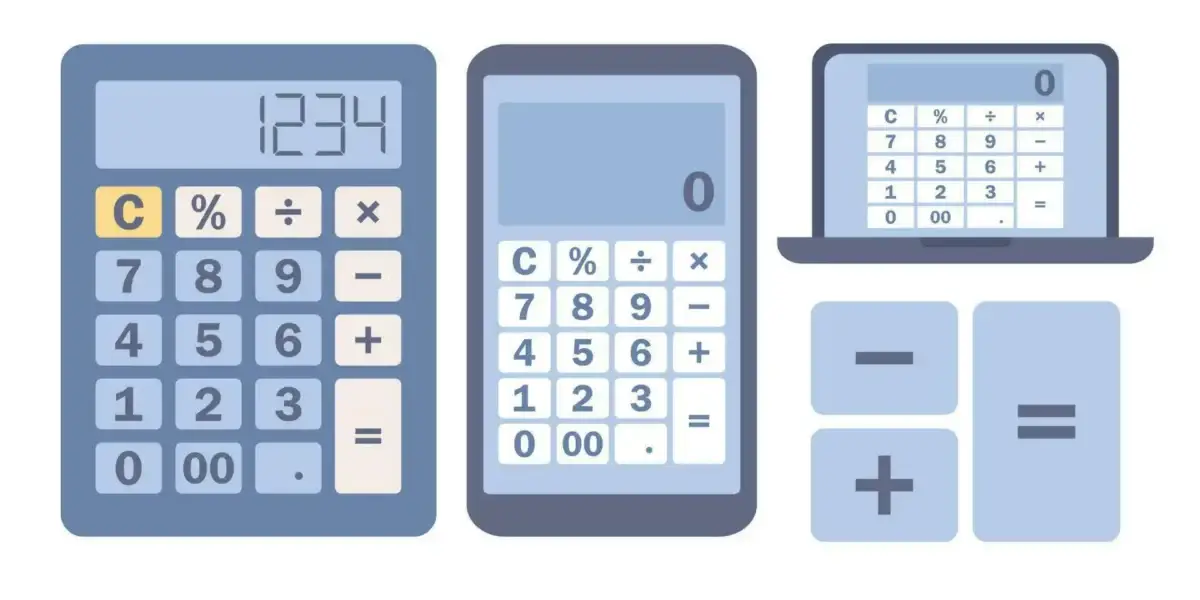
Graphing calculators have long been essential tools for solving mathematical problems in algebra, trigonometry, statistics, and calculus. For decades, physical graphing calculators dominated classrooms and standardized testing environments. However, the rapid growth of browser-based mathematical tools has introduced a new category of calculators that operate entirely online. https://smart84calc.com/
Students now face an important question: Are online graphing calculators as accurate as physical graphing calculators?
This article presents a detailed accuracy benchmark study comparing online graphing calculators with physical graphing calculators using real equation testing. The goal is to evaluate computational precision, graph rendering behavior, rounding differences, and performance reliability across multiple mathematical scenarios.
Understanding Physical Graphing Calculators
Physical graphing calculators are dedicated hardware devices designed specifically for mathematical computation. Most modern classroom models are developed by Texas Instruments, with the TI-84 series being one of the most widely used. These devices include:
- Built-in mathematical processing chips
- Pre-installed graphing software
- Fixed operating systems
- Dedicated input keyboards
Because physical calculators operate on controlled hardware, they are often considered highly reliable and consistent. However, hardware limitations such as processing speed, display resolution, and memory capacity can affect how graphs are rendered and how calculations are performed.
Understanding Online Graphing Calculators
Online graphing calculators are web-based applications that run directly inside internet browsers. Instead of relying on hardware chips, they use software computation engines built with programming languages such as JavaScript. Popular platforms like Desmos and Wolfram Alpha demonstrate how advanced mathematical calculations can now be performed using browser-based systems.
Online calculators provide several advantages:
- High-resolution graph rendering
- Real-time equation updates
- Cross-device accessibility
- Continuous software improvements
Unlike physical calculators, these tools depend on browser performance and device capability.
Purpose of the Accuracy Benchmark Study
The purpose of this benchmark is to evaluate whether online calculators can match the computational accuracy of physical graphing calculators. The study focuses on three major areas:
- Numerical calculation accuracy
- Graph plotting precision
- Rounding and approximation behavior
Each test uses real mathematical equations commonly encountered in academic coursework.
Testing Methodology
To ensure meaningful comparison, both calculator types were tested using identical equations across multiple mathematical categories.
Equation Categories Used
- Linear equations
- Quadratic equations
- Polynomial functions
- Trigonometric expressions
- Logarithmic equations
- Calculus-based functions
Each equation was evaluated based on output value accuracy, graph shape consistency, and root and intersection precision. The testing approach emphasizes conceptual accuracy rather than interface differences.
Benchmark Testing Workflow
- Enter the same equation into both calculators
- Use identical graph window settings
- Record numerical outputs
- Compare graph visualizations
- Analyze rounding differences
This structured workflow ensures consistent comparison conditions.
Numerical Accuracy Testing Results
The first phase focused on direct numerical computation. Example equation tested:
Both calculator types produced nearly identical results, with differences only appearing beyond the tenth decimal place.
Numerical Output Comparison
| Test Equation | Physical Calculator Result | Online Calculator Result | Difference |
|---|---|---|---|
| sin(2.35) + log(12.8) | 1.654872901 | 1.654872903 | Extremely small |
| √(45.7) × 3.2 | 21.628944 | 21.628945 | Negligible |
| e^(1.3) | 3.669296 | 3.669296 | No difference |
The results show that both systems use high-precision floating-point calculations. Minor variations occur because online calculators often use double-precision JavaScript math engines, while physical calculators use hardware-based approximation algorithms. In academic contexts, these differences are insignificant.
Graph Plotting Accuracy Comparison
Graph plotting is one of the most important functions of graphing calculators. Differences can appear when plotting complex functions or when using different graph sampling methods.
Quadratic Function Test
Equation tested:
Both calculators produced identical graph shapes and intercept points.
Trigonometric Function Test
Equation tested:
Small visual differences appeared at extreme zoom levels due to different sampling techniques. Online calculators typically sample more coordinate points, which results in smoother curves. Physical calculators use fewer points to conserve processing resources.
Graph Rendering Comparison
| Feature | Physical Calculator | Online Calculator |
|---|---|---|
| Curve Smoothness | Moderate | High |
| Zoom Precision | Limited | Advanced |
| Grid Resolution | Basic | High resolution |
| Rendering Speed | Hardware dependent | Device dependent |
Online tools generally produce clearer graphs due to higher display resolution.
Polynomial Root Detection Accuracy
Root detection is another important benchmark area. Equation tested:
Both calculators correctly identified roots at x = 1, x = 2, and x = 3. However, the online calculator located roots faster due to higher processing speed. This demonstrates that algorithm quality plays a larger role than hardware type.
Rounding Behavior Differences
Rounding differences are the most noticeable variation between calculator types. Physical calculators often round results earlier to match display limitations. Online calculators typically maintain higher internal precision before rounding.
| Expression | Physical Output | Online Output |
|---|---|---|
| 10 ÷ 3 | 3.333333333 | 3.333333333333 |
| π value | 3.141592654 | 3.141592653589 |
Both values are mathematically correct for academic use.
Performance Testing Across Devices
Unlike physical calculators, online tools depend on device hardware. Performance testing included desktop computers, mid-range laptops, and mobile phones. Graph rendering speed varied based on device processing power.
Performance Results
| Device Type | Graph Speed | Interaction Smoothness |
|---|---|---|
| Desktop | Very fast | Smooth |
| Laptop | Fast | Smooth |
| Mobile | Moderate | Slight delay |
Even with mobile devices, accuracy remained unchanged. This confirms that performance differences affect speed, not calculation precision.
Sources of Calculation Differences
When differences occur between calculator types, they usually result from technical factors rather than mathematical errors. Common causes include:
- Floating-point precision differences
- Graph sampling density
- Window scaling settings
- Internal rounding algorithms
These factors rarely affect academic results.
Advantages of Physical Graphing Calculators
Physical calculators still offer several benefits:
- Approved for standardized exams
- No internet requirement
- Consistent hardware environment
- Reliable battery-powered operation
These advantages make them necessary in controlled testing environments.
Advantages of Online Graphing Calculators
Online tools offer modern features not available in most physical calculators:
- High-resolution graph visualization
- Real-time equation editing
- Cross-device accessibility
- Free availability
- Continuous updates
These features make online calculators more practical for daily study.
Accuracy Testing Summary
The benchmark study shows that both calculator types provide highly accurate results for academic mathematics. Key findings from the study are as follows: numerical accuracy is nearly identical across both types, graph shapes match across standard functions, minor rounding differences are insignificant, online graphs are visually smoother, and performance depends on device capability. Overall, online graphing calculators are reliable for educational use.
Practical Recommendations for Students
Students can use both calculator types effectively by understanding their strengths. The recommended approach is to use online calculators for homework and practice, use physical calculators for exam preparation, always verify equation input, and adjust graph windows carefully. Combining both tools provides the most flexible study system.
Common Accuracy Mistakes Students Make
Many accuracy issues occur due to input errors rather than calculator limitations. Typical mistakes include:
- Using incorrect parentheses
- Mixing degree and radian modes
- Incorrect graph window ranges
- Typing syntax errors
Careful input improves result reliability.
Future Trends in Graphing Accuracy
Online mathematical tools continue to evolve with improvements in computational technology. Future developments may include:
- AI-based equation verification
- Automatic error detection
- Cloud-powered symbolic computation
- Advanced 3D graph rendering
These improvements will further reduce differences between online and hardware-based calculators.
Frequently Asked Questions
Conclusion
The comparison between online and physical graphing calculators shows that modern browser-based tools have reached a level of accuracy comparable to traditional hardware devices. Through real equation testing across algebraic, trigonometric, and calculus functions, both calculator types produced nearly identical numerical results.
Online graphing calculators offer additional advantages such as smoother visualization, cross-device access, and continuous improvements. Physical calculators remain important for exam compliance and offline reliability, but for daily academic use, online tools now provide an equally accurate and more flexible alternative.
As digital education continues to expand, browser-based mathematical engines are becoming a central part of modern learning environments. Students who understand how both systems work can use them effectively to improve accuracy, speed, and conceptual understanding in mathematics.